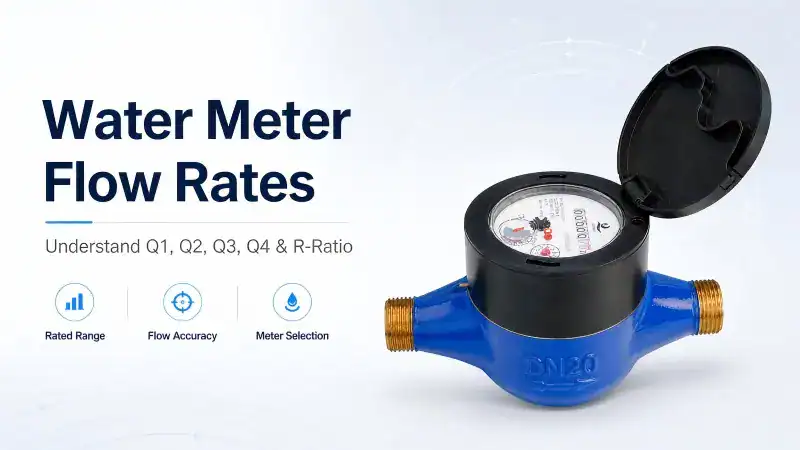
Q1, Q2, Q3, and Q4 tell you where a water meter can measure reliably, run continuously, and handle a brief peak. Once you understand these four flow rate values and the R-ratio, reading a datasheet—and choosing the right meter—becomes much easier.
How Q1, Q2, Q3, and Q4 Define Water Meter Flow Rate
Flow rate describes the volume of water moving through a pipe during a period of time. It is commonly shown in cubic meters per hour (m³/h) or liters per hour (L/h). A water meter flow rate specification uses four Q values to describe the meter’s approved measurement range.
| Value | Flow rate name | What it tells you |
| Q1 | Minimum flow rate | The lowest rated flow at which the meter stays within its maximum permissible error |
| Q2 | Transitional flow rate | The boundary between the lower and upper error zones |
| Q3 | Permanent flow rate | The highest rated flow for continuous operation under specified conditions |
| Q4 | Overload flow rate | The highest rated flow allowed for a short period |
Q1: The Minimum Flow Rate
Q1 marks the bottom of the rated measuring range. At or above this value, the water meter must measure within the error limit for its accuracy class. This parameter matters when your system needs to record dripping taps, nighttime consumption, or other very small water demand.
A meter may produce a reading below Q1, but that reading has no stated error guarantee. Starting flow is a separate value: it only shows when the measuring mechanism first responds. It should not be used as the minimum accurate flow rate.
Q2: The Transitional Flow Rate
Q2 separates two error zones. The lower zone runs from Q1 to just below Q2, while the upper zone runs from Q2 through Q4. Under ISO 4064-based specifications, you calculate Q2 with a fixed relationship: Q2 = 1.6 × Q1.
Q3: The Permanent Flow Rate
Q3 is the maximum flow rate at which the meter is rated to operate continuously under its stated working conditions. It is a key sizing parameter, but it is not necessarily the typical flow in your pipe. Normal system demand may sit well below this permanent limit.
Q4: The Overload Flow Rate
Q4 covers brief peaks. The meter must perform within the applicable error limit at this flow and maintain its metrological performance afterward. The standard relationship is Q4 = 1.25 × Q3. Regular operation near Q4 usually signals that you should review meter size and peak demand.
How to Calculate Flow Rate and R-Ratio
Volumetric flow rate is the change in water volume divided by time:
Q = V ÷ t
If 200 liters pass through the meter in four minutes, the flow rate is 50 L/min. Multiply by 60 to get 3,000 L/h, then divide by 1,000 to get 3 m³/h. Keep every unit consistent before you calculate.
The R-ratio describes the width of the rated measurement range:
R = Q3 ÷ Q1
Independent Water Meter Flow Rate Datasheet
This sheet starts with Q3, not pipe diameter. Calculate Q1 = Q3 ÷ R, then Q2 = 1.6 × Q1; Q4 equals 1.25 × Q3. Q1 and Q2 are shown in L/h, while Q3 and Q4 are in m³/h. Meter size alone does not set these ratings.
| Q3 (m³/h) | Q4 (m³/h) | R80 (L/h) | R160 (L/h) | R200 (L/h) | |||
| Q1 | Q2 | Q1 | Q2 | Q1 | Q2 | ||
| 1.6 | 2.0 | 20 | 32 | 10 | 16 | 8 | 12.8 |
| 2.5 | 3.125 | 31.25 | 50 | 15.625 | 25 | 12.5 | 20 |
| 4.0 | 5.0 | 50 | 80 | 25 | 40 | 20 | 32 |
| 6.3 | 7.875 | 78.75 | 126 | 39.375 | 63 | 31.5 | 50.4 |
| 10 | 12.5 | 125 | 200 | 62.5 | 100 | 50 | 80 |
| 16 | 20 | 200 | 320 | 100 | 160 | 80 | 128 |
| 25 | 31.25 | 312.5 | 500 | 156.25 | 250 | 125 | 200 |
For example, follow the Q3 = 2.5 row to R160: Q1 is 15.625 L/h, Q2 is 25 L/h, and Q4 is 3.125 m³/h. A higher R lowers Q1 and Q2; it does not increase Q3 or Q4.
How Accuracy and Flow Testing Work
Water meter accuracy is not expressed by one error percentage across the entire range. Q2 divides the range because the maximum permissible error changes between lower and higher flows.
| Class 2 zone | Flow range | Maximum permissible error at 0.1°C–30°C |
| Lower zone | Q1 ≤ Q < Q2 | ±5% |
| High zone | Q2 ≤ Q ≤ Q4 | ±2% |
A laboratory test compares the meter’s indicated volume with a known reference volume or calibrated reference device. The bench establishes a stable test flow, passes enough water to control measurement uncertainty, and calculates the relative indication error.
- Check starting flow separately from Q1 accuracy.
- Test near Q1 and Q2 to examine low-flow performance and the transition.
- Test at intermediate values and near Q3 for regular operating performance.
- Test near Q4 under the required overload condition.
- Use the approved installation orientation and specified pipe arrangement.
Required volume is not universal for every meter. It depends on bench resolution, meter design, target flow, and the applicable procedure. Temperature, pressure, flow disturbance, and installation position must also remain within the stated conditions.
The chart below shows how the Class 2 error limits change across the rated flow range. The lower zone allows ±5% error, while the upper zone allows ±2%.
Choosing the Right Water Meter for Your System
Start with real demand data instead of nominal pipe size alone. Identify the smallest flow you need to measure, regular operating flow, and the highest short-term demand. Then compare those values with Q1, Q3, and Q4. Incorrect sizing can reduce billable volume, increase pressure loss, and shorten meter life.
- For small leaks: look for a suitably lower Q1 and an appropriate R-ratio. An oversized meter may under-register low flow and lose billable water.
- For continuous demand: keep expected operating flow within Q3. An undersized meter can create excessive pressure loss.
- For peak periods: confirm that short peaks remain within Q4. Frequent overload accelerates wear and may shorten service life.
- For accurate measurement: check accuracy class, temperature class, and approved orientation.
- For long-term performance: consider water quality, pipe conditions, and maintenance access.
Do not treat a larger R-ratio as an automatic sign of a better meter. The best specification is the one that matches your actual flow profile and system conditions. You can compare mechanical, AMR, ultrasonic, and electromagnetic water meter types before narrowing the selection.
Looking for a Reliable Water Meter Manufacturer?
DEAZESU is a professional water meter manufacturer with over 20 years of experience. We supply mechanical, AMR, ultrasonic, and electromagnetic water meters for global projects, and support remote reading solutions with NB-IoT, LoRa, and 4G technologies .
Whether you are sourcing for residential, commercial, or municipal water projects, DEAZESU is ready to help. You can explore more on our products page or contact us to discuss your project and request a quote .
FAQs about Water Meter Flow Rates (Q1, Q2, Q3, Q4)
Is Q3 the normal operating flow rate?
Not necessarily. Q3 is the highest permanent flow rate allowed under rated conditions. Your typical operating flow can be lower, and the actual demand profile should guide selection.
Does water below Q1 go unmeasured?
Not always. The meter may respond below Q1, but accuracy is not guaranteed there. For measuring low water usage, focus on the rated Q1 rather than the starting-flow value.
Can two water meters with the same pipe size have different flow ranges?
Yes. They can have different Q3 values, R-ratios, measurement methods, accuracy classes, or installation ratings. Compare the full datasheet instead of relying on size alone.
What information should you send a water meter supplier?
Provide pipe size, minimum expected flow, normal flow, peak flow, water temperature, pressure, installation position, communication requirements, and the relevant approval standard. Better input data makes meter selection faster and more precise.