
SMART METERING AND ACOUSTIC LEAK DETECTION
See the loss. Narrow the search. Track the repair.
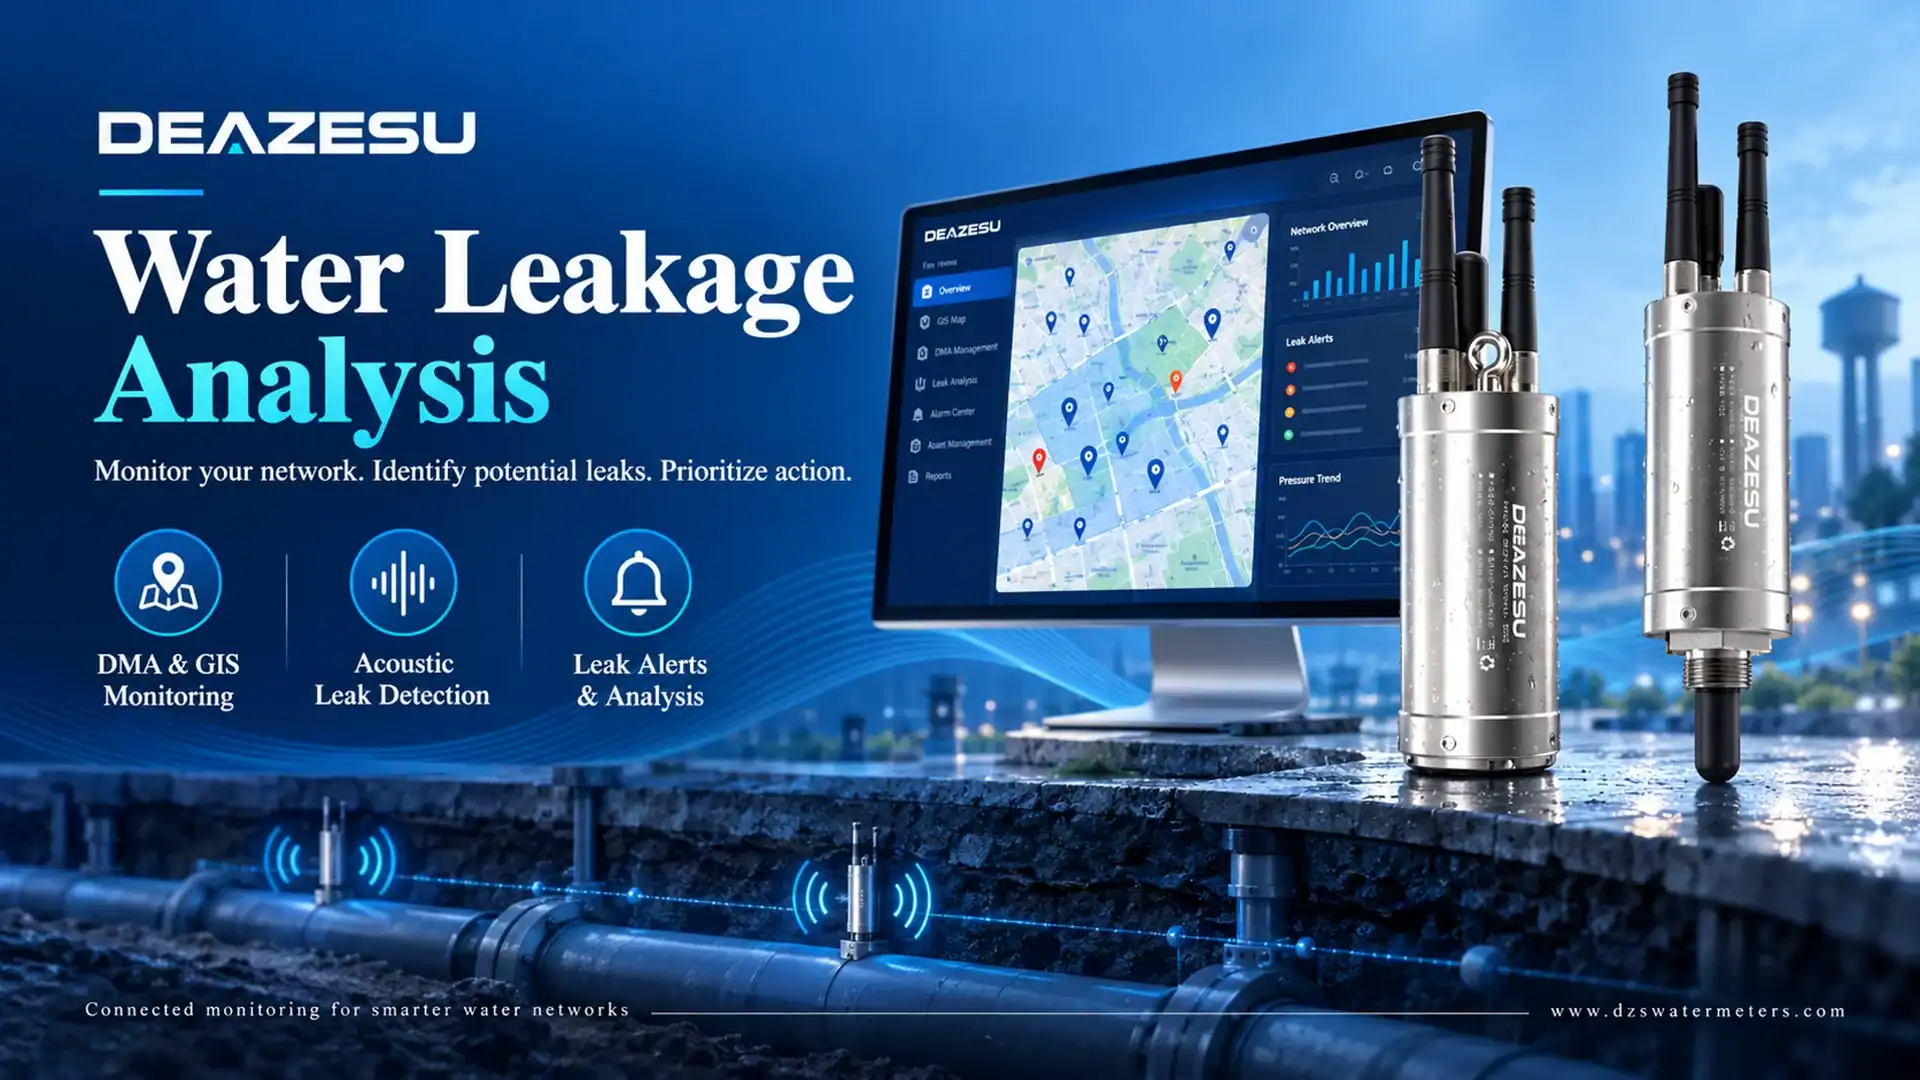
Non-revenue water is not one problem — it is three
Physical loss
Leaks in mains, service connections and tanks. In Peru, physical losses represented about 73% of 2024 NRW-around 611 milion m³.
Apparent loss
Metering and billing errors, unauthorised use and unbilled consumption. Better micro-metering directly reduces these losses.
Measurement gap
Unmetered districts hide the true loss. Peru reported 38.17% NRW, while SEDAPAL has replaced more than 200.000 meters a year since 2023.
Better measurement, district analysis and acoustic detection help locate losses and verify that repairs worked.
STEP 1 — DISTRICT METERING SHRINKS THE SEARCH AREA
Divide the network into metered districts and compare inlet volume with customer consumption. Minimum night flow, pressure and boundary data show which district should be investigated first—not the exact leak location.
| What district metering needs | Typical source | Why it matters |
| District inlet volume | Bulk or large-diameter meter at the DMA inlet (ultrasonic / electromagnetic) | The denominator of every water balance |
| Customer consumption | AMR/AMI meter readings inside the district | Separates real loss from apparent loss and billing gaps |
| Minimum night flow | Inlet meter, 02:00–04:00 window | The clearest leak signal a district produces |
| Pressure | Pressure sensor or smart meter sensor | Explains night-flow changes and burst risk |
| District boundaries | GIS asset records | A wrong boundary makes every number suspect |
STEP 2 — ACOUSTIC MONITORING LOCATES HIDDEN LEAKS
Acoustic terminals detect leak noise at selected pipe points and compare signals over time. Performance depends on pipe material, diameter, pressure, sensor spacing, background noise and installation quality.
An alarm identifies a location for investigation—not a confirmed leak. Field verification is required before excavation.
An alarm identifies a location for investigation—not a confirmed leak. Field verification is required before excavation.
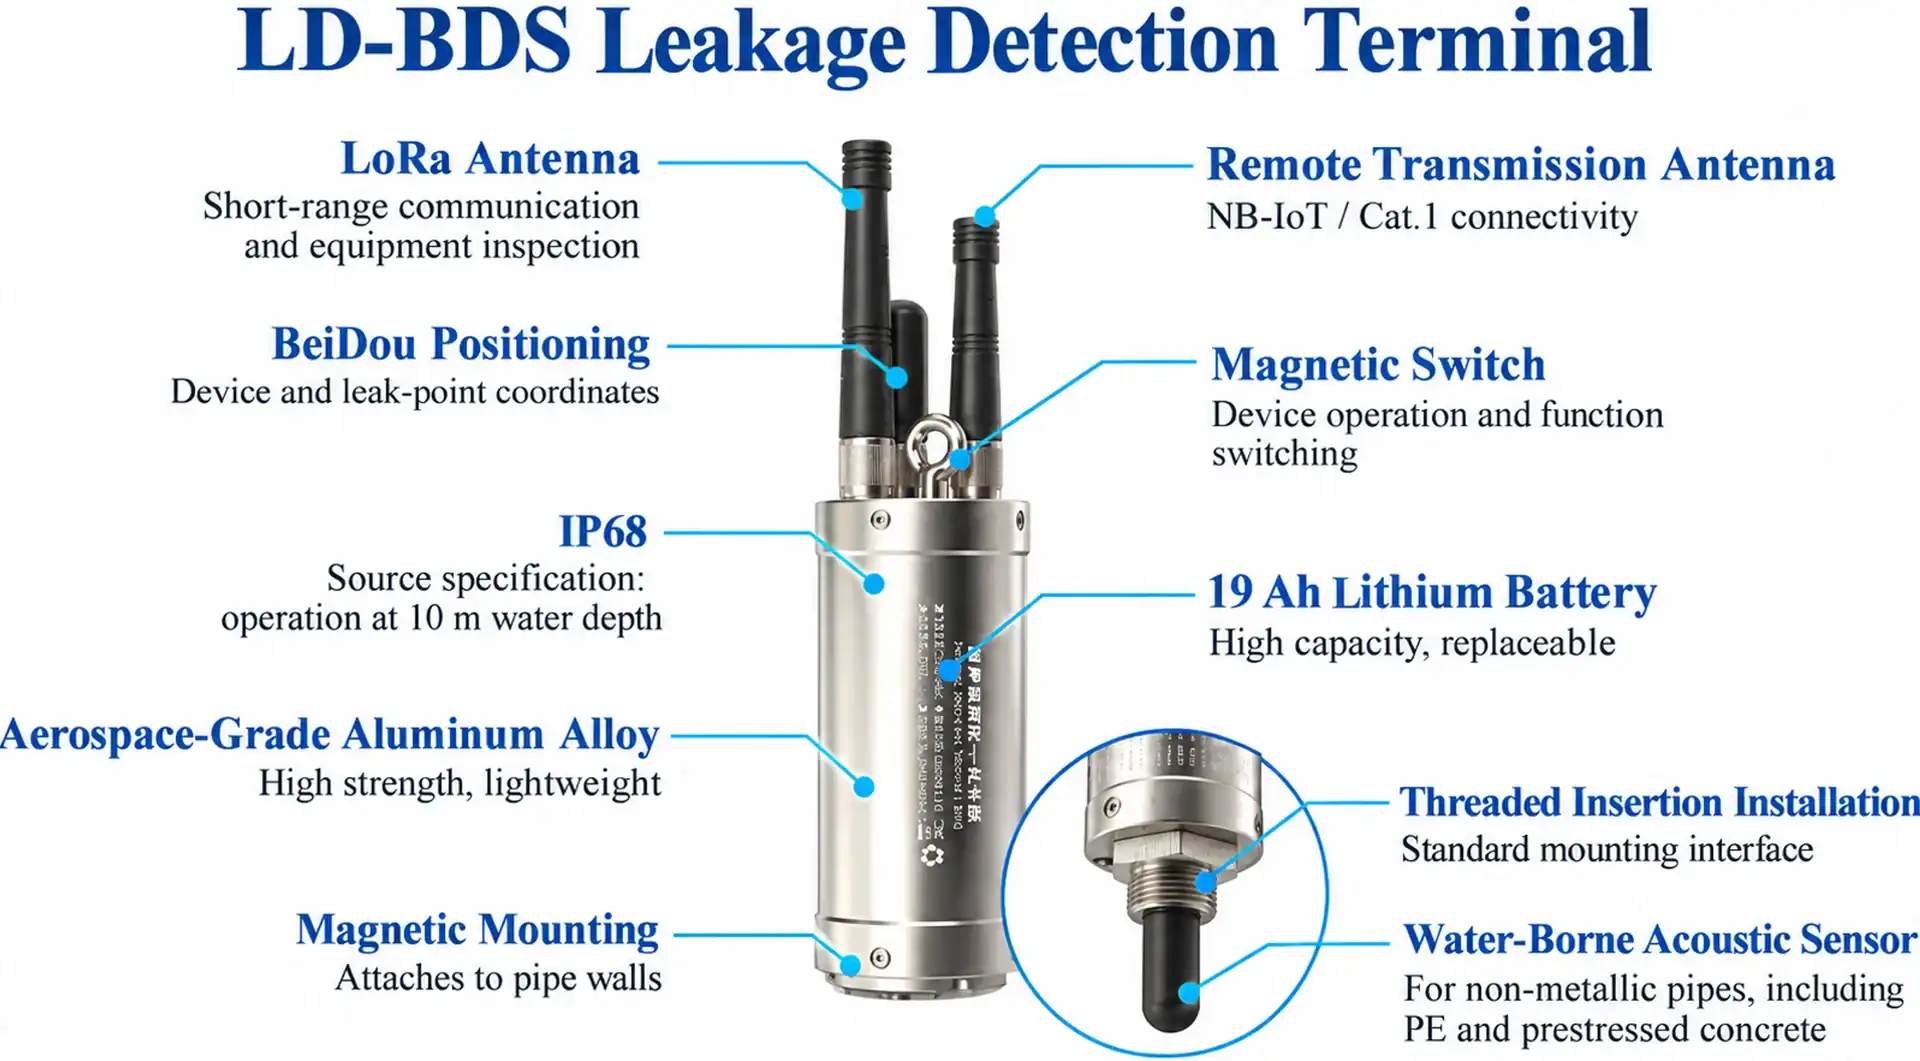
Figure 1 — LD-BDS leakage detection terminal: acoustic sensor, IP68 housing and dual communication antennas.
| Item | Specification |
| Acoustic sensing | Water-borne acoustic sensor; suitable for non-metallic pipes including PE and prestressed concrete |
| Mounting | Magnetic mounting on pipe walls; threaded insertion installation |
| Housing | Aerospace-grade aluminium alloy |
| Ingress protection | IP68 — operation at 10 m water depth |
| Battery | 19 Ah lithium battery, replaceable |
| Positioning | BeiDou positioning for device and leak-point coordinates |
| Remote transmission | NB-IoT / 4G Cat.1 |
| Local / inspection link | LoRa, for short-range communication and equipment inspection |
| Operation | Magnetic switch for device operation and function switching |
STEP 3 — ONE PLATFORM TURNS ALERTS INTO A WORK LIST
| Group | Functions |
| Leakage early warning | Installation management · map distribution · online acoustic listening · intelligent analysis · leak-point location |
| Statistical analysis | Intelligent reports · leak report submission · leak statistics · abnormal alarms · equipment positioning |
| Business processing | Deployment tasks · planning and navigation · work-order processing · operation management · equipment ledger |
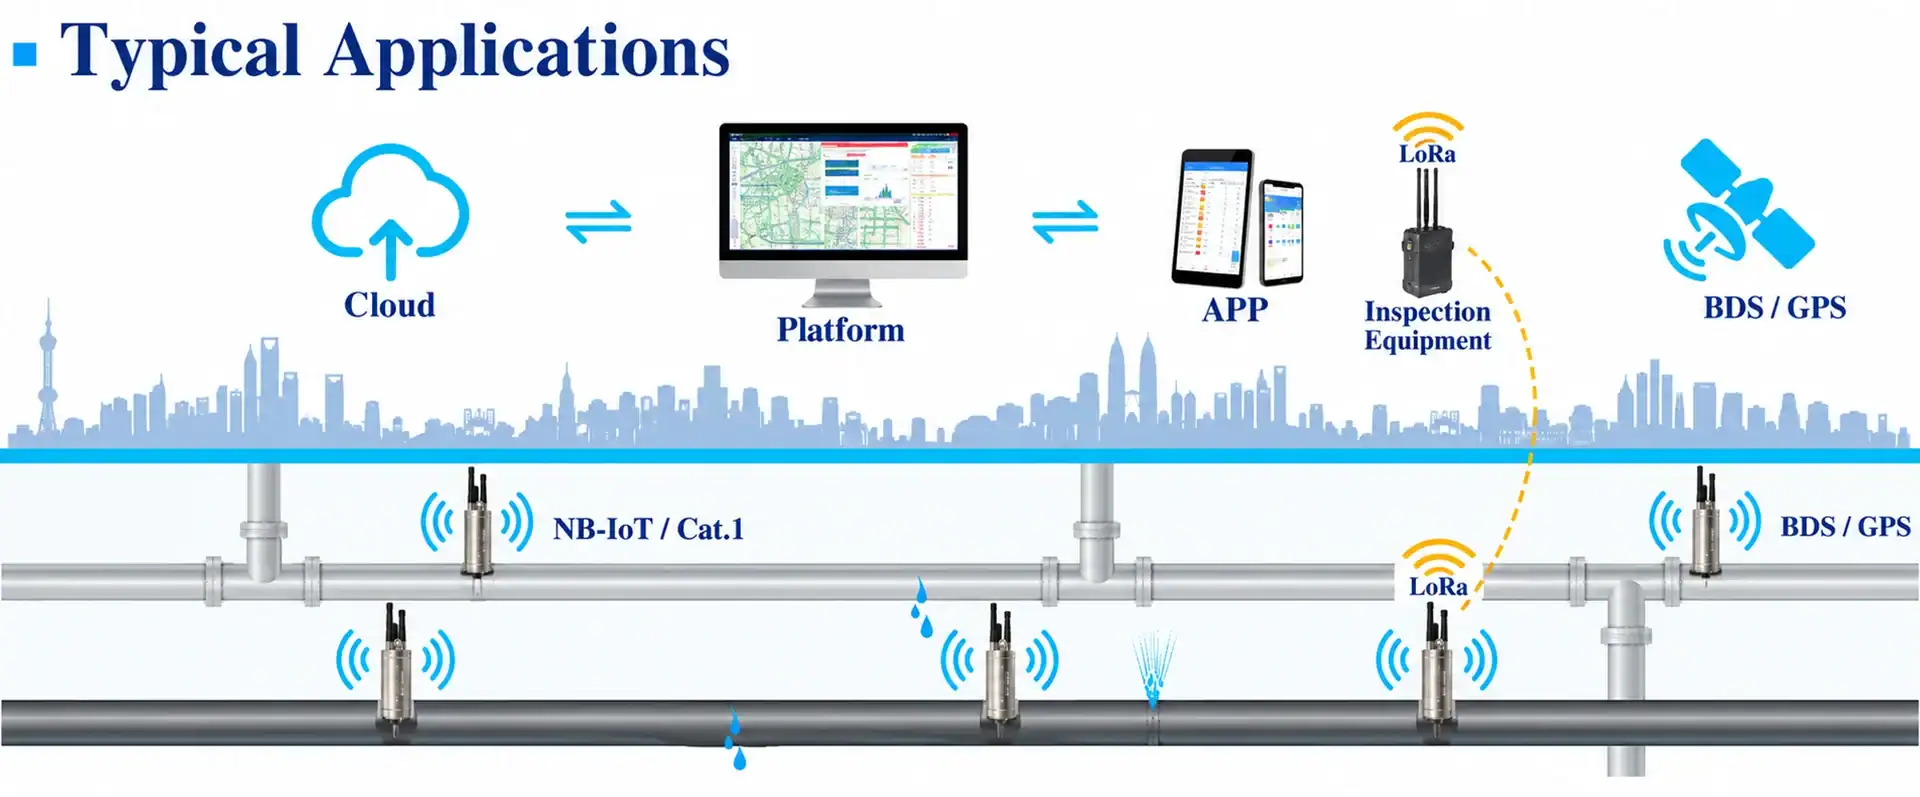
Figure 2 — Typical applications: cloud platform, desktop and mobile apps, inspection equipment, BeiDou/GPS positioning and NB-IoT / Cat.1 / LoRa links.
A useful alarm should show the monitoring point, event time, recent signal behaviour and available asset information. The field team can then investigate the location, record the result and update the case.
Because water-loss data comes from different systems, the platform may need information from meters, GIS, SCADA, billing or inspection records. The required interfaces should be agreed during project planning.
STEP 4 — CLOSE THE LOOP: VERIFY THE REPAIR
The work is not complete when an alarm is acknowledged. After the suspected location is confirmed and repaired, review the district flow and acoustic record again. A closed event should show what was found, what was repaired and whether the monitored condition returned to normal.
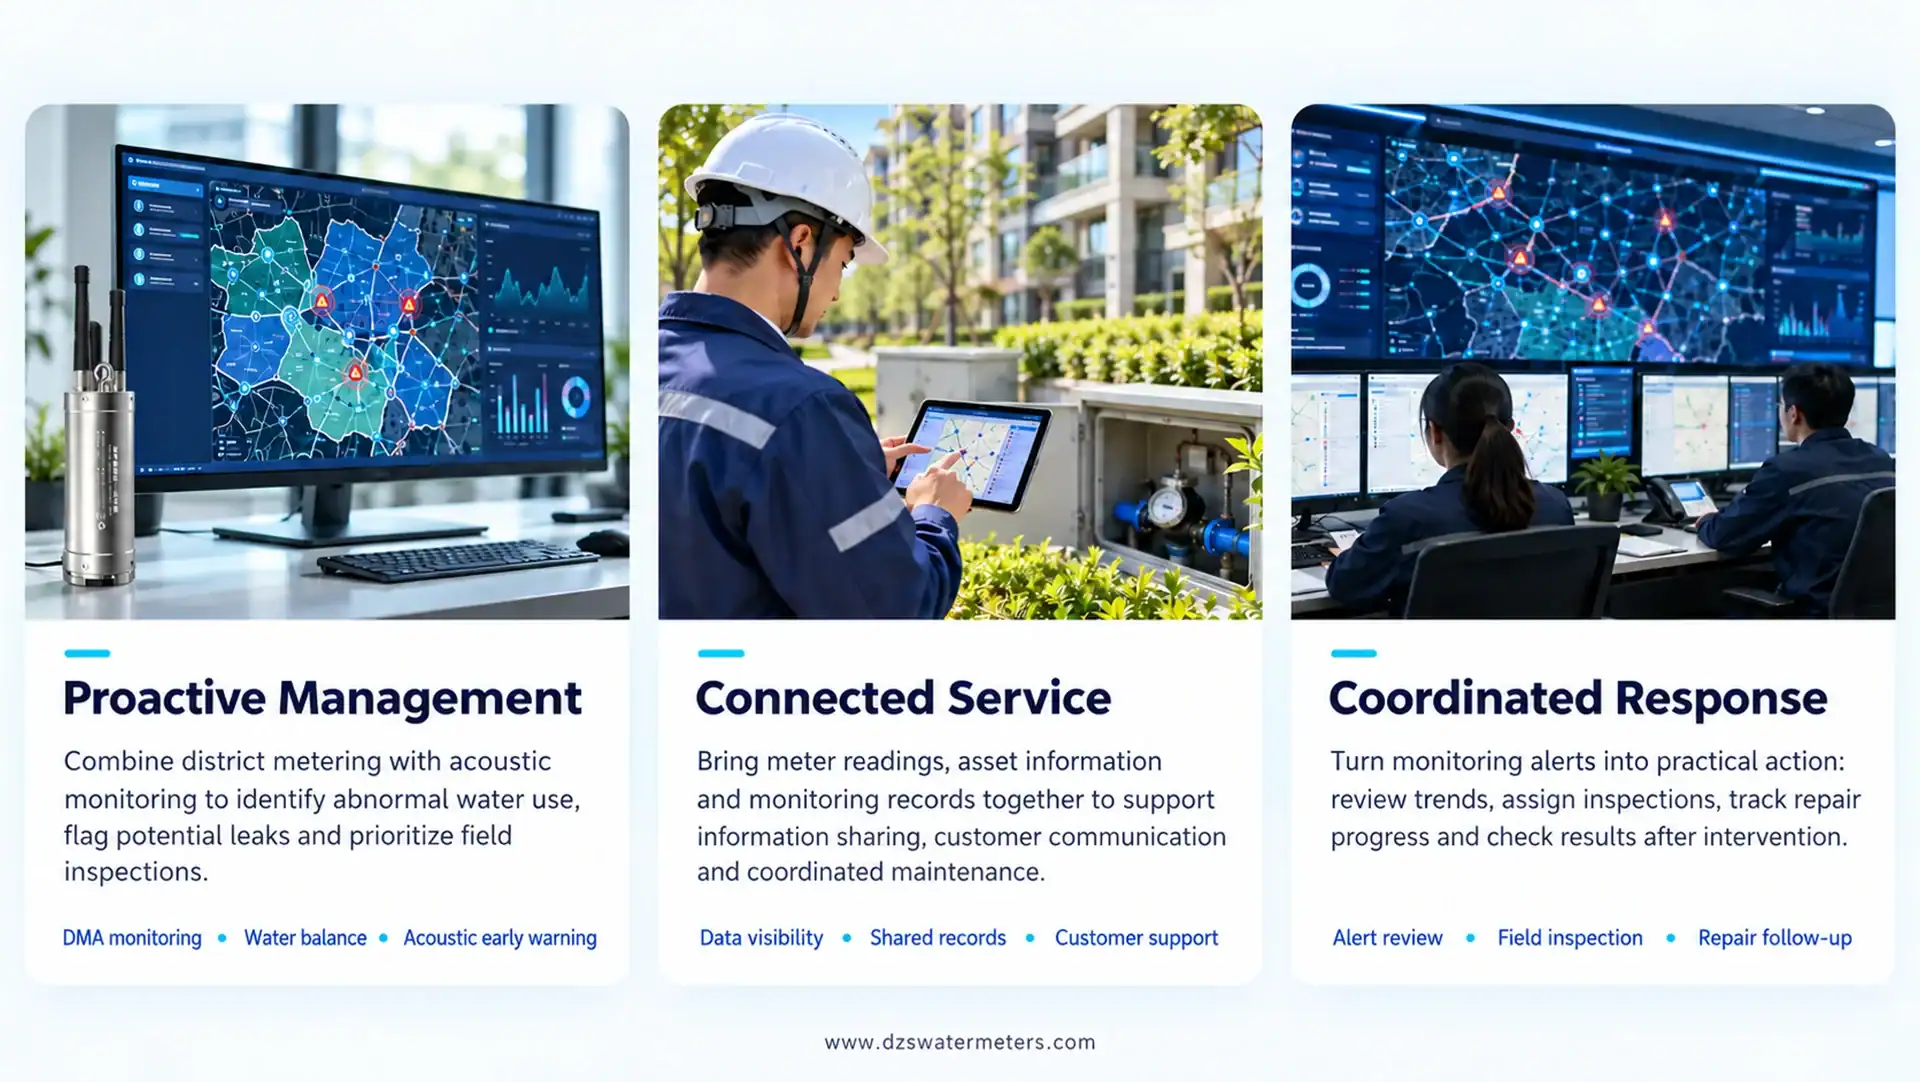
Figure 3 — Proactive management, connected service and coordinated response.
PHASED DEPLOYMENT
| Phase | What happens |
| Days 1–30 | Confirm district boundaries and inlets; install or verify inlet metering; establish the baseline water balance and minimum night flow for each pilot district |
| Days 31–60 | Clean up customer meter readings (or deploy AMR/AMI reading); install acoustic terminals at the highest-risk segments of the worst districts; start alarm review |
| Days 61–90 | Run the workflow: alert → inspection → repair → re-measure; issue the first verified report and compare loss before and after |
Connectivity is selected for site conditions: NB-IoT or 4G Cat.1 for wide-area reporting, LoRa for local links, and BeiDou for positioning.
WHAT IMPROVES AFTER DEPLOYMENT
Targeted Response
Crews are directed to the affected pipe segment instead of searching an entire district.
Verified Results
Every repair is re-measured, creating clear before-and-after evidence.
Better Decisions
District records support loss targets, regulatory reporting and future investment planning
COMMON QUESTIONS
| Do we have to replace every meter? |
| No. Start with the districts where loss is highest. Inlet metering and acoustic detection will find work to do before a single customer meter is changed — but the more automated the customer readings, the more precisely real loss can be separated from apparent loss. |
| Does acoustic detection work on plastic pipe? |
| Yes. The terminal is available with a water-borne acoustic sensor designed for non-metallic pipes, including PE and prestressed concrete, and mounts by threaded insertion. On metallic pipe it can be attached magnetically to the pipe wall. |
| How is it powered and maintained? |
| The terminal runs on a replaceable 19 Ah lithium battery and is rated IP68 for operation at 10 m water depth. Devices are addressed individually in the platform, with an equipment ledger for maintenance. |
| How many terminals does a district need? |
| It depends on pipe material, diameter and how far noise travels in your network — which is why a pilot district is instrumented first and the spacing is set from the results. On metallic mains, noise carries further and fewer points are needed; on plastic pipe, water-borne sensing at closer spacing is usually more reliable. |
| Can it work with the systems we already use? |
| The platform holds metering data, detection records and location. Integration with GIS, SCADA, billing and inspection systems is configured per project. |
| How quickly can we see a result? |
| Pilot districts can be instrumented and reporting within weeks. Non-revenue water reduction is a programme, not a purchase: the value compounds as more districts join the loop. |
TALK TO US ABOUT YOUR DISTRICTS
Send us your district layout and your latest loss figures. We will come back with a staged proposal: which districts to instrument first, what metering is required, and what the first 90 days should deliver.
Contact Us